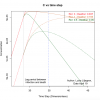
The solid lines below are output for "I" from an SEIR model I ginned up. I'm an engineer so it's non-dimensional.

(To get a feel for time from "time step" multiply by 2 days which corresponds to the "lag" in an SEIR model.) I call everything "concentration" because it's a fraction of the total population.
The solid is the trace shows how the fraction of the population that is currently infectious grows with time if Ro=0. Then at at a particular time (picked arbitrarily) I stuck in a "quarantine" which affects R0. So, in the sort of brown case, I made R0=1, in the green case I made R0=0.5. Looking at the solid lines, the model predicts that the number of infectives continues to rise for a while, then, flattens (as expected) for R=1, it drops for R0=0.5.
BUT infectives aren't deaths. that's not deaths. So, I did a kludgy thing and just added a "deaths" to the SEIR. It's to get a qualitiative view of what the deaths will look like. Since SEIR aleady looks like a model for a stirred reactor, I then put in another box of deaths. I lagged that by the 15 days (and divided by 2... to make dimensionless.) These "daily deaths" (scaled to fit on graph) are shown on the graph.
(BTW: the actual numbers are pretty arbitrary because I just started the quarantine at an arbitrary time and my model for deaths.... well... my model eventually kills everyone who gets sick. We would just multiply that by the actual mortaility rate to get a more reasonable number, but then it wouldn't fit on the graph. So... qualitatively, this shows how things "would look".)
Anyway: Using this (not very wonderful model-- but not so horrible for purposes of visualizing
- With no quaratine, deaths would have continue to look linear on the semi-log graphs. (Red dotted.)
- If Ro=1 after quarantine, daily deaths would be rising during the lag period between quarantine and deaths. The bend happens later. See the brownish line.
- If Ro=0.5, we'd start to see flattening during the lag period.
So: I think the quarantine has Ro<1. Because the shape we are seeing is more like the green than the brown.